Patch Telemetry UI
Last updated on September 16, 2021.
Document Status: Document Developer Quality Complete.
Important
Patch Telemetry UI will only work with a modern browser (Edge v93.0+ and Firefox v92.0+).
Documentation bundled with Patch Telemetry UI is accurate as of 9/16/2021.
Updated documentation can be found at: https://reactr.azurewebsites.us
Introduction
The purpose of the Patch Telemetry UI is to review the patching status for the nodes under the root node.
Note
Patch Telemetry UI is only available at the root node. The telemetry files will only exist for RPS v4.0 nodes.
How to Use the Patch Telemetry Desktop Application
This is a desktop application that will be installed on the root node from the Azure image.
Set the Patch Telemetry Folder Location
Open the appsettings.json configuration file and update the value for CDNFilePath. This is the path to the patch telemetry data files stored by the packaging service. This data is synced between the root and child nodes using RPS.CDN.
Note
By default, the path is C:/CDN/PatchTelemetry.
Application
Once the desktop application is opened, you can select the available telemetry nodes in the left-hand side panel.
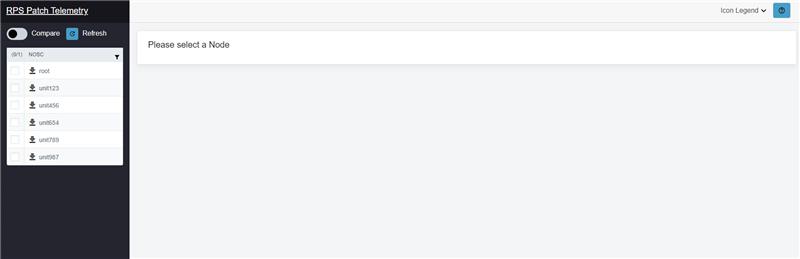
Figure 1: RPS Patch Telemetry UI landing page.
The list of available nodes can be filtered. To view the filter options, click the advanced filter icon ▾ at the top of the list of nodes in the left-hand side panel.
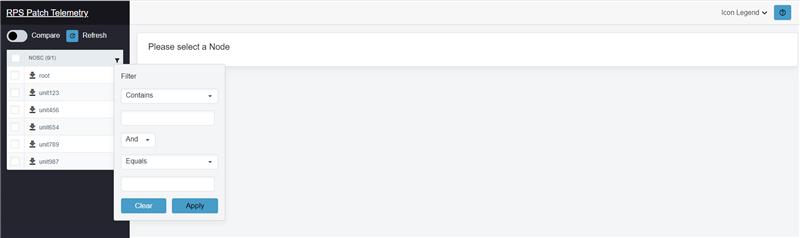
Figure 2: RPS Patch Telemetry UI advanced filter.
Once a node is selected, the available telemetry data will be displayed in the Node Details panel on the right. The details panel groups the data by patch stream.
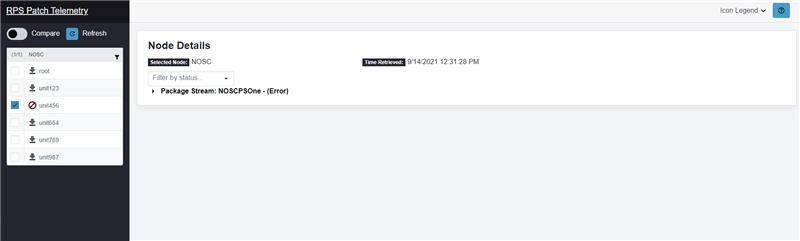
Figure 3: Select a node from the list to view the related telemetry data.
Using the Filter by status... dropdown in the Node Details panel, you can filter the data by the following patch stream statuses:
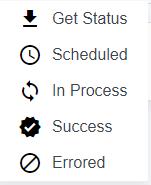
Figure 4: RPS Patch Telemetry UI Icon Legend.
Comparing Multiple Nodes
At the top of the left-hand side panel, there is a Compare toggle that enables "compare mode". By toggling this switch, you can compare two nodes.
Note
Only two nodes can be compared with the Compare toggle.
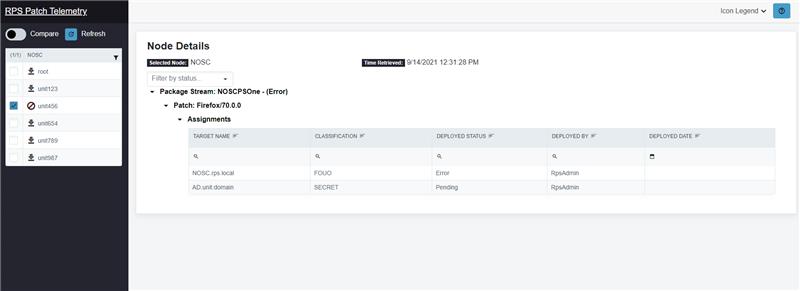
Figure 5: Node Details panel with expanded data (Compare mode off).
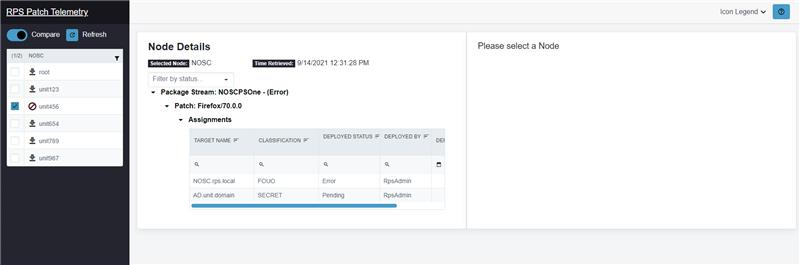
Figure 6: Node Details panel with expanded data (Compare mode on).
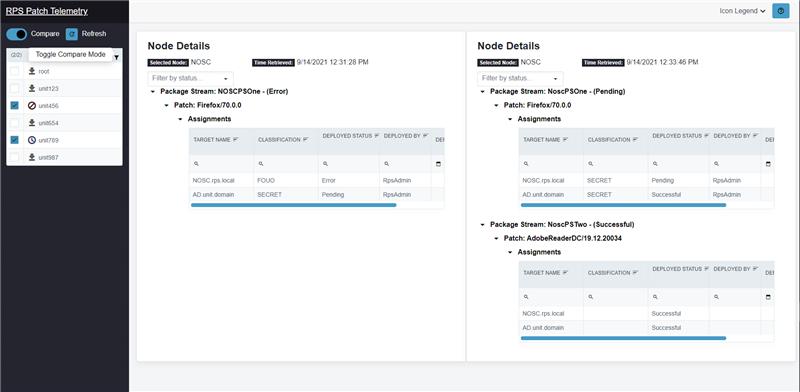
Figure 7: Node Details panel with compare node selected (Compare mode on).
Troubleshooting
Unable to Reach the Patch Telemetry UI Home Page
Issue: Attempting to reach the Patch Telemetry UI home page in a browser does not show a web page.
Remedy Steps:
- Verify PatchTelemSvc is running.
- Make sure browser version is correct (Edge/Firefox).
- Verify correct home page for deployed Patch Telemetry UI.
Empty Node Panel
Issue: The list of available nodes on the left-hand side panel is empty on startup.
Remedy steps:
- Make sure the browser version is correct (Edge/Firefox).
- Verify the appsettings config for CDNFilePath is correct.
- Verify valid files exist in the CDN Patch Telemetry folder.